
Economic Measures
Methodology Overview
Introduction
Core to our approach is the use of the Population Attributable Fraction (PAF), the epidemiological construct used for calculating the share of a population that has a given disease that can be attributed to exposure to a known risk factor for the disease. We calculate the PAFs for different behavior-disease pairs (e.g. sodium consumption and hypertension; sleep duration and depression) and then calculate an aggregated cost across all relevant behavior-disease pairs. The methodology breaks down into four main steps, described below.
Step 1: Model the influence of company products and services on user health behaviors at the population level
Step 2: Calculate relative risks of developing selected diseases due to modified behavior
Step 3: Estimate the number of cases of selected diseases that could be attributed to the company’s influence
Step 4: Calculate the annual cost of the attributable cases
Step 1:
Model the influence of company products and services on user health behaviors at the population level
To calculate the PAF for a given disease, using Levin’s formula [1], you need two input variables: RR, or the relative risk of developing the disease if exposed to the risk factor, and Pe, or the population exposed to the risk factor. To calculate RR, you combine two relationships: 1) the degree to which a key health behavior is influenced by a product; and 2) the relative risk of developing the associated disease as a function of the level of that behavior. Estimating the influence on behavior depends very much on the product itself, or the type of product, and the behavior. For products that influence dietary habits, one can look at the nutrition information about different menu items. For products that facilitate sedentary lifestyles, one can look at studies linking the products to users’ levels of physical activity. In some cases, the behavior is inherent to the product or service: a video streaming service inexorably leads to television viewing; a bicycle leads to cycling.
The table below shows examples from our prototyping work.
Product/Service
quick service restaurant
Behaviors Influenced
diet
Sources
published nutrition information for each menu item
video streaming service
television viewing
inherent to the service
mobile game
physical activity, sleep
published research studies linking use of the product to those behaviors
The objective at this stage of the process is to identify a quantitative relationship between use of the product and the health behavior in question. After that, you need to estimate Pe, or the population exposed to the product. Again, the techniques will depend on the type of product, but often it will involve some industry data on a company’s annual sales, market share, and overall use of the category of product.
Example:
For a quick service restaurant, determining Pe involved developing a nutritional profile of a standard diet from a high-volume customer and then, using sales data, estimating the total calories sold by the restaurant, calculating how many people eating that standard diet would be needed to make up that total calories sold amount, and then dividing that number of people by the US adult population. For the streaming service, Pe was simply the company's share of the total hours of television viewed.
Step 2: Calculate relative risks of developing selected diseases due to modified behavior
Step 2 consists of two components: 1) identifying scientific studies that link changes in selected behaviors (or consumption of selected nutrients) to increased or decreased risks of developing selected diseases; and 2) calculating the relative risk for each disease given the influence that the product has for the behavior that is a risk or protective factor.
We have made determinations as to whether to include studies in our calculations based on functional and quality criteria. Our functional criteria include:
Behavior/nutrient match. Does the study use, as an independent variable, a behavior or nutrient of interest, meaning that the behavior or consumption of the nutrient has been associated with the products we were studying and measured in a way that matches the way it has been associated with the use of the product.
Quantitative dose-response relationship. Does the study link the behavior/nutrient to the disease in quantitative terms through identification of relative risk? Is the relationship expressed as a dose-response relationship or can a dose-response relationship be inferred or approximated from the study?
Disease match. Does the study link the behavior/nutrient to a disease or of interest and does it define the disease such that it is compatible with other studies that used that disease as a dependent variable?
We also review the studies in terms of quality and applicability:
We prioritize meta-analyses that pool observational cohort and cross-sectional studies and conduct dose-response calculations. The higher number of underlying studies the better.
We check to ensure that studies included in meta-analyses generally control for likely confounding variables.
We prioritize studies that cover broad populations in terms of age, gender and race.
We have a library of studies that we have used in our calculations available in our Evidence and Data page.
Ideally, you are able to determine RR as a function of the daily level of the behavior, or as a function of the incremental increase or decrease of the behavior.
Example:
The influence of consumption of sugar-sweetened beverages (SSBs) on type 2 diabetes has been shown to be a linear relationship with a RR of 1.19 for every 250 mL serving/day.
Calculating the RR for the behavior-disease pair typically requires applying the product’s impact on the behavior to the RR.
Example:
If a quick service restaurant results in an average of 400 ml/day of SSBs and the RR for type 2 diabetes is 1.19 for every 250 ml/day, then the RR would be 1 + 0.19 x (400/250), or 1.304.
One of the challenges with this step is that chronic diseases typically develop after years of exposure to risk factors. For example, studies might show that television viewing increases the risk of cardiovascular disease (CVD) by following participants over 5 or 10 years to see if there are associations between television viewing on a year-by-year basis and the presence of CVD at the 5- or 10-year marks. People exposed to a risk factor in one year are not in complete overlap with people who are treated for the chronic disease in the same year. If the behavior and the product are relatively stable over several years, you could make the assumption that the populations are largely equivalent. Alternatively, one could develop modeling techniques that followed populations from initial exposures through projected disease onsets and subsequent years of treatment cost. Dealing with this timescale mismatch is an area of ongoing research interest.
Step 3: Estimate the number of cases of selected diseases that could be attributed to the company’s influence
The Levin formula for calculating the PAF is:
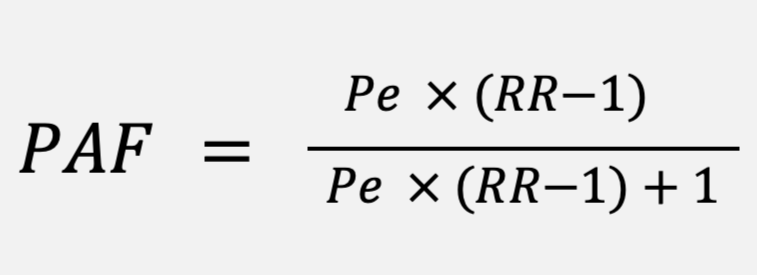
For each behavior-disease pair, simply plug in the values for Pe and RR to get the PAF.
In some cases, a product can influence the same disease through multiple pathways. For example, both high SSB consumption and low fiber consumption can increase the risk of depression. To calculate a combined PAF that represents the share of the disease prevalence that can be attributed to exposure to the product, you can combine PAFs additively or multiplicatively. The choice depends on the particular biological pathways, but in practice, our experience so far suggests that the impact of the choice is relatively minor and we have generally gone with the additive approach as it is more conservative.
Example:
If the RR for a restaurant’s influence on depression due to fiber is 1.09 and 1.25 for SSB consumption, then the additive formula is 1.09 + 1.25 - 1, or 1.34. The multiplicative approach is 1.09 x 1.34, or 1.3625.
After calculating the PAF for each disease, you multiply it by the prevalence of the disease to come up with the number of cases that can potentially be attributed to the company. The Evidence and Data page includes sources for identifying the prevalences of common chronic diseases.
Step 4: Calculate the annual cost of the attributable cases
The final step involves identifying the annual healthcare costs associated with treating different chronic diseases. The Evidence and Data page includes sources for these costs, which typically come from academic studies rather than regular government reports.
Two adjustments are typically needed. First, as costs are not typically published annually, some will need to be adjusted for inflation. Second, some chronic diseases are also risk factors for other chronic diseases, so you have to be careful about double counting. For example, cardiovascular disease can be a common complication of type 2 diabetes. As such, if costs for both CVD and type 2 diabetes are both to be included, then it’s important to back out the CVD complications from the type 2 diabetes costs.
Once the annual cost per case is determined for each disease, it can be multiplied by the number of attributable cases to arrive at a total annual cost per disease for the company. Summing across all impacted diseases generates a total cost for the company.
References
Levin ML. The occurrence of lung cancer in man. Acta Unio Int Contra Cancrum. 1953;9(3):531–41